
A study published in September 2026 by the hosting provider NovaHoster highlights a marked gap between the performance of Tunisian websites on desktop and on mobile. On sites with exploitable measurements, the median time to display the main content reaches 6.7 seconds on mobile, compared with 1.2 seconds on desktop. The study covers 205 sites across twelve sectors.
According to the disclosed results, 85% of measured sites are above Google’s 2.5-second threshold for a mobile experience deemed satisfactory. 44% exceed eight seconds. Among the 120 sites fully analyzed, 117 had an exploitable mobile measurement for the speed distribution.
A significant gap between desktop and mobile
It is one of the study’s main findings. On desktop, the median time to display the main content is 1.2 seconds. On mobile, it reaches 6.7 seconds, i.e., about 5.5 times longer.
The full loading of a page takes, in median, 11.8 seconds on mobile.
The study indicates that this gap does not typically originate from hosting. The median server response time measured is 89 milliseconds, well below the 600-millisecond threshold used as a reference in the study.
The authors instead point the diagnostic toward page design, script execution and the multiplication of requests made by the browser.
For Amine Dammak, head of Novatis and founder of NovaHoster, part of the problem lies in the fact that mobile versions remain technically close to desktop versions: columns and menus are visually adapted, but the same images and scripts are sometimes still loaded.
This finding is all the more important as smartphone use occupies a central role in web access in Tunisia.
The weight of a page does not explain everything
Another takeaway from the study: a heavy page is not necessarily slow.
The correlation calculated between a page’s weight and its display time is only 0.03, indicating a very weak association in the studied panel.
By contrast, the correlation between the number of network requests and the display time reaches 0.46. This is a moderate association, which is not sufficient by itself to establish a causal link but provides an element for diagnosis.
JavaScript is also a point of vigilance. The median time during which it blocks the browser reaches 558 milliseconds, versus a recommended threshold of 200 milliseconds used in the study.
The authors give the example of the education sector: analyzed pages weigh a median of 8.8 MB but display their main content in 5.5 seconds. Administrations show a median weight of 2.4 MB but require 7.2 seconds.
The proliferation of third-party scripts, audience measurement tools, discussion modules, consent banners, carousels, fonts or advertising tools can thus weigh more on the user experience than the mere volume of data transferred.
35% of the analyzed sites exceed 100 network requests per page. One of the studied sites generated 271. For the site recording the longest load time, the measurement was stopped after 45 seconds without the load finishing.
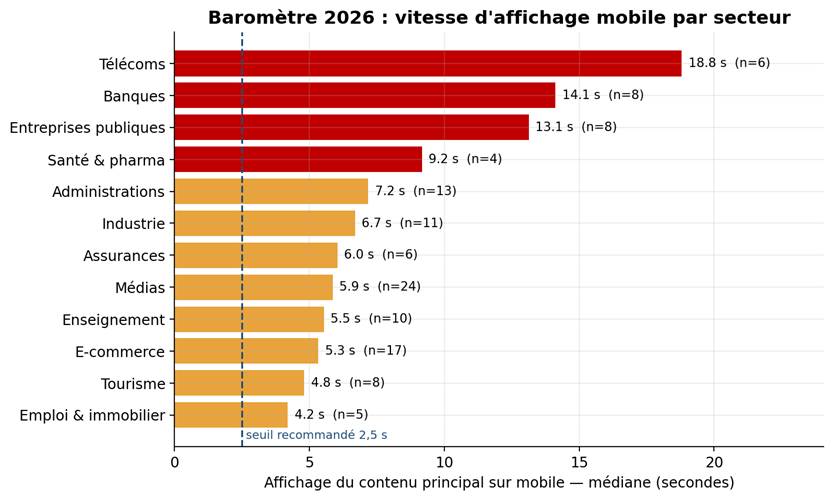
Median mobile display time by sector. Source: NovaHoster study 2026.
Telecommunications, banks and public enterprises show high times
The study distributes the results across twelve sectors.
Telecommunications record a median of 18.8 seconds for the display of main content on mobile. They are followed by banks, with 14.1 seconds, then by public enterprises and transport, with 13.1 seconds.
At the other end of the ranking stand sites related to employment, real estate and services, with 4.2 seconds, followed by tourism and hospitality at 4.8 seconds, then e-commerce and distribution at 5.3 seconds.
The sector medians are as follows:
- Employment, real estate and services: 4.2 s
- Tourism and hospitality: 4.8 s
- E-commerce and distribution: 5.3 s
- Education: 5.5 s
- Media: 5.9 s
- Insurance and leasing: 6.0 s
- Industry and groups: 6.7 s
- Administrations: 7.2 s
- Healthcare and pharmacy: 9.2 s
- Public enterprises and transport: 13.1 s
- Banks: 14.1 s
- Telecommunications: 18.8 s
Results for sectors with fewer than six sites analyzed should, however, be regarded as indicative. This is particularly the case for health-pharmacy and the employment-real estate-services category.
The study provides no information on budgets spent by companies or institutions on their digital platforms. It therefore cannot establish a link between the level of spending and performance.
It does, however, propose an organizational lead: in large structures, the homepage can gradually accumulate several functions, institutional campaigns, carousels, measurement tools, consent solutions, messaging, or custom fonts, whose cumulative effect ends up affecting performance.
Two sectors also stand out with server response times above the overall median: 708 milliseconds for education and 346 milliseconds for telecommunications. In these cases, the infrastructure also plays a role in the observed results.
One site in two does not respond without “www”
The study also examined domain name configurations. On a sub-sample of 94 sites, NovaHoster tested four address variants: with or without “www” and using HTTP or HTTPS.
47 sites out of 94, exactly 50%, did not respond when the address was entered without the “www” prefix.
According to the study, this problem can result from a missing DNS entry, a certificate not covering the variant without “www”, or the absence of a properly configured redirection.
The sectors where this anomaly is most frequent are health and pharmacy, industry, and administrations.
In the same sample, 22 sites did not automatically redirect HTTP traffic to HTTPS, while nine could only be measured in HTTP due to an unusable HTTPS version.
Furthermore, 13 sites offered the same content under multiple addresses without designating a canonical version, a configuration likely to complicate their search engine optimization.
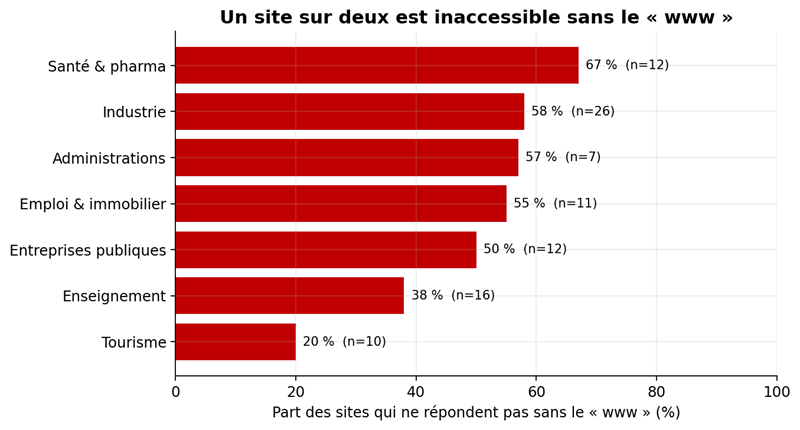
Share of sites that do not respond without the “www”, by sector. Source: NovaHoster 2026 study.
Technical corrections without necessarily rebuilding the entire site
For NovaHoster, several identified problems could be addressed through targeted technical interventions.
Among the proposed measures are removing unnecessary third-party scripts, deferring non-essential JavaScript, using newer image formats suited to actual display dimensions, and enabling compression and caching.
The study also recommends ensuring that all variants of a domain name correctly redirect to a single address.
NovaHoster announces its intention to repeat this study annually on the same panel to track performance evolution.
No site is individually identified in the published results. The data are presented as medians by sector, while those responsible for technical aspects can request results for their own platform.
Things to keep in mind
The study is based on point-in-time measurements taken in September 2026. Of the 205 sites constituting the initial panel, 120 were fully analyzed, 117 had an exploitable mobile measurement for speed distribution, and 94 were subjected to testing of the different address variants.
The results therefore reflect the state of the sites at the time of testing and should be interpreted as sector medians, not as a permanent measure of each site’s performance.