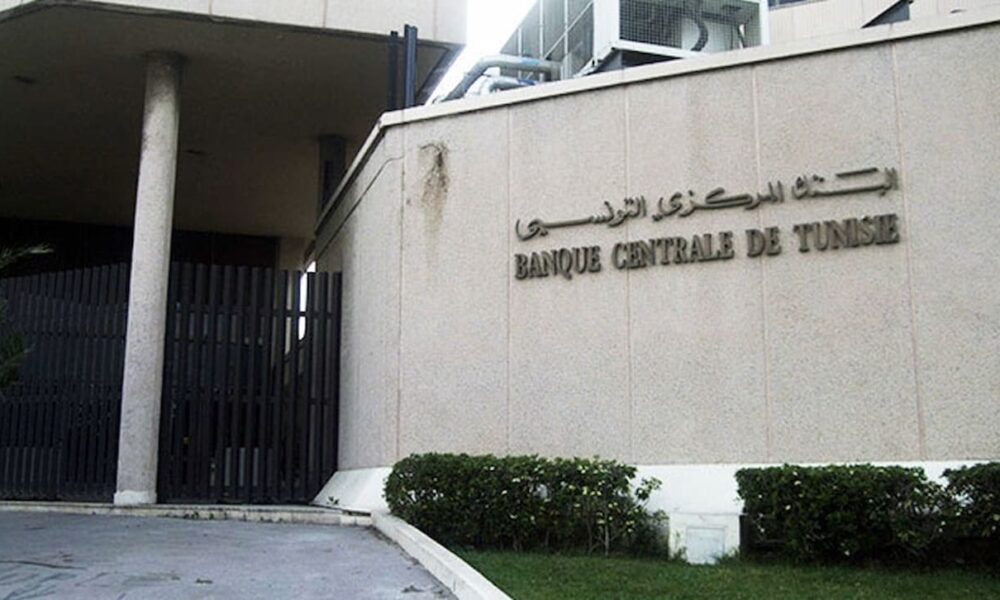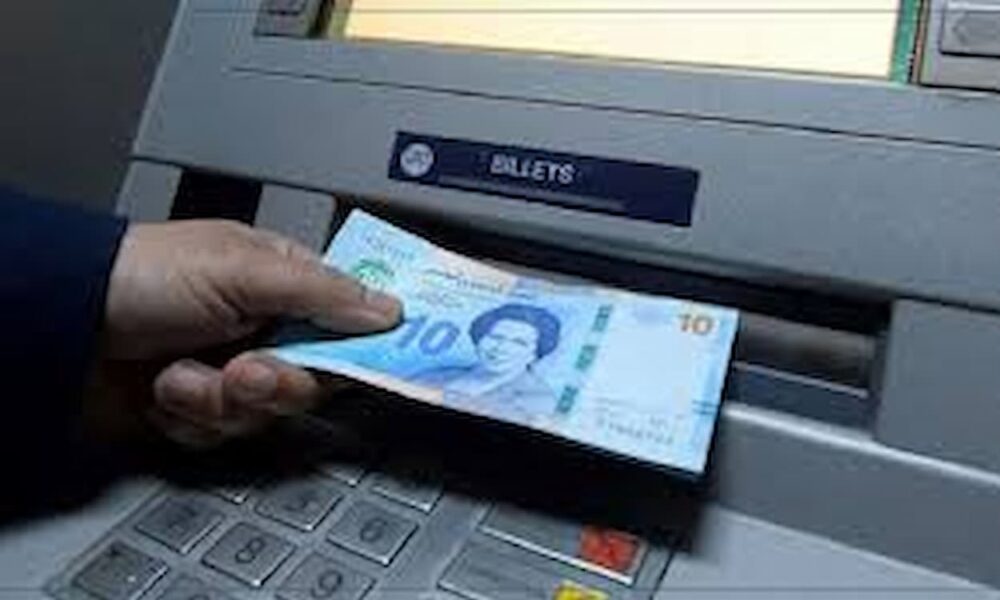
The number of bank cards in Tunisia reached 6.493 million as of September 30, 2026, recording an 11% rise compared with December 31, 2025, according to data from the Central Bank of Tunisia (CBT).
This development is accompanied by an increase in both the number and the value of card payments. They totaled 24.43 billion dinars in the first nine months of 2026, up from 21.98 billion dinars during the same period in 2025.
The essentials
- 6.493 million bank cards as of end-September 2026, up 11% from end-December 2025.
- 3,333 ATMs (Automated Teller Machines), up 1% over the same period.
- 135.7 million payment transactions in the first nine months of 2026, up 10.5% year on year.
- 24.43 billion dinars of card payments, up 11.1% year on year.
- 44% of electronic operations are payments, versus 40% a year earlier.
Nearly 6.5 million bank cards in Tunisia
According to indicators published by the Central Bank of Tunisia, the card base stood at 6.493 million cards as of September 30, 2026, up by 11% from the end of 2025.
Meanwhile, the number of ATMs (DAB/GAB) reached 3,333 units, reflecting a 1% increase compared with December 31, 2025.
These figures show a much faster growth in the card card base than in the ATM network. However, both indicators reflect stock levels observed on a given date rather than cumulative volumes of transactions.
Card payments exceed 24 billion dinars
The activity of card payments also progressed during the first nine months of 2026.
The cumulative number of payment operations reached 135.7 million as of September 30, 2026, up from 122.8 million as of September 30, 2025, a rise of 10.5%.
In value, payments rose from 21,983.7 million dinars in the first nine months of 2025 to 24,429.2 million dinars in the same period of 2026, an increase of 11.1%.
The difference represents 2,445.5 million dinars more in card payments over the year, according to a calculation by Tunisia Numérique based on amounts published by the CBT.
Card payments: key figures for 2025 and 2026
| Indicator | 30/09/2025 | 30/09/2026 | Change |
|---|---|---|---|
| Number of payments | 122.8 million | 135.7 million | +10.5% |
| Value of payments | 21,983.7 MD | 24,429.2 MD | +11.1% |
| Share of payments in the number of operations | 40% | 44% | +4 points |
| Share of payments in the value of operations | 25% | 26% | +1 point |
Source: Central Bank of Tunisia. Cumulative data for the first nine months of each year. MD: million dinars. The shares shown are those displayed in the CBT chart.
Card payments gain ground against cash withdrawals
The distribution of electronic payment operations also shows a shift toward payments relative to cash withdrawals, referred to as the “cash-out” in CBT statistics.
In the first nine months of 2026, payments accounted for 44% of the total number of electronic operations, up from 40% in the corresponding period of 2025. In value, their share reaches 26%, up from 25% a year earlier.
Conversely, cash withdrawals represent about 56% of the number of operations and 74% of their value in the first nine months of 2026, according to the supplementary proportions calculated from the CBT chart.
These data highlight a growth in card payments within Tunisia’s electronic payments activity, while cash withdrawals continue to account for the majority of the amounts processed.